Quantitative analysis and data visualization software

An online tool that enables you to import data from your studies, analyze them, and share them in the form of interactive dashboards and reports.
IMPORT: load data from different sources

Import external data
-
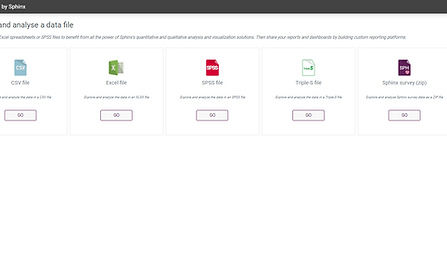
Easily import your data from different sources: XLSX, CSV, SPSS, TripleS, etc.
-
Upload data from your CRM, Google reviews and other survey tools
-
Connect via API and analyze in real time

Connected to our survey tools
-
DATAVIV' connects directly to our survey tools Declic and iQ so that you can manage your study from start to finish without needing to export/import, clean up data, or adjust the formats
-
Analyze results in real time to follow the development of your projects live


ANALYZE: Explore quantitative and qualitative data

Study your data by harnessing the power of statistical analysis in a simple and intuitive interface.
-
Advanced statistical analysis: bivariate and multivariate analysis, geographic maps, satisfaction matrices, K-means, comparative tables, regression, AFC, ACP, etc.
-
Additional calculation options: rebalancing, weighting of variables and responses, calculation of new variables, relationship diagrams, highlighting of over- and under-represented values, etc.

Quantitative analysis

Leverage the richness of words through lexical and semantic analysis.
-
Exploration: word clouds and comments filtered by contextual variables such as score, service, age, etc.
-
Various ways of identifying topics: manual coding and automatic dictionary coding

Qualitative analysis
COMMUNICATE: Share your results

Interactive dashboards
Display results using key indicators and a broad selection of customizable graphs.
-
Capture attention through storytelling: pop-up analysis illustrating results, automatic highlighting of important factors, etc.
-
Let readers segment and explore the results with interactive filters
-
Track results at all times with real-time updates
-
Share results according to profile and allow access to datasets based on e.g. department, service, location, etc.

Results reports
Study data more thoroughly and drill down into details.
-
Create a report that can be used to guide long-term actions: strategic plans, time-period comparisons, achieving goals, etc.
-
Dig deeper with advanced statistical analysis: satisfaction matrices, multivariate analysis, comparative tables, text analysis, etc.
-
Include more sophisticated graphs for a professional and original report
-
Export and print the report in multiple formats to share it around your company: PDF, PowerPoint, Word, OpenOffice, or CSV

Try now on your mobile device

Dynamic infographics
Share your results with your social networks or on your website via interactive infographics.
-
Fully customizable: vast library of icons and shapes, image import function, wide variety of text formats, etc.
-
Dynamic and impactful, thanks to interactive filters that bring the results to life


