
Teaching quality assessment
Student satisfaction evaluation platform
Le Sphinx offers a tailor-made platform for collecting data, analyzing feedback and sharing results as part of projects to evaluate student satisfaction.
It combines the skills and experience of the evaluation team with the power of our technology and innovation to deliver an effective and efficient quality platform.
Rewatch our most recent event
with the participation of
1
Online survey
The platform includes a preprogrammed survey that has been tested and approved by numerous European universities.
Survey features
-
5 evaluation sections (content, teaching material, assessment methods, teaching quality, course impact)
-
Numerous evaluation criteria (including objectives, materials, variety of content, and command of content)
-
Open-ended questions
-
Prefilled fields (date, department, course, teacher, etc.)
-
Multiple language options (Spanish, English, French and Polish)
-
Responsive design compatible with any device (PC, cell phone, tablet, etc.)
On top of that, the survey is 100% editable and can be customized independently (switching colors, university logo, questions, languages, etc.), meaning that bespoke measurement is guaranteed.
2
Automatic survey distribution


Your quality department can manage survey distribution independently.
The emailing module allows you to automate the mail-out of customized emails to all students. You can set the text of the email, the send date, and the text and dates of reminders.
It also gives you the possibility of printing out the surveys and scanning them for automatic data collection (Scanner option).
In addition, you can generate a QR code for the survey, which students can scan from the bulletin board.
3
Automatic reporting
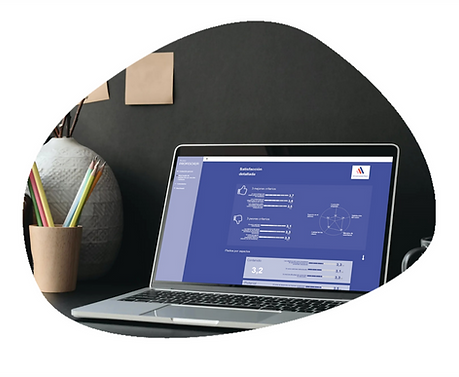
The evaluation platform integrates a preprogrammed report that updates automatically after each round of evaluations.
Report contents
-
Overall evaluation
-
Breakdown of evaluations for each criterion
-
Areas for improvement
-
Changes in satisfaction between semesters and years
-
Dynamic and interactive comparisons (of courses, departments, professors, years, etc.)
-
Text analysis
The reports are 100% customizable; both the content (graphs, tables, calculations, etc.) and the style (logo, colors, explanations, etc.) of the report can be adjusted to meet the needs of each quality department.

User-specific reporting
Each user (professor, head of department, dean, president) has their own particular set of responsibilities: a professor will exclusively need to see a detailed breakdown of their own evaluations, while the president will need a global picture of all courses and general trends.
Therefore, access to the report may be conditioned by user profile, so that each user may access only the data/analysis that is relevant to them. It is the adminstrator who decides which content each profile can access.
A professor...
-
Can see an overview and a breakdown of evaluations
-
Can read the comments written by students
-
Can compare satisfaction with their courses by group
A head of department...
-
Sees an overview of the evaluations and a detailed breakdown for their department
-
Sees student comments filtered by course, professor, etc.
-
Can compare the department's courses and professors with the university average or with each other
-
Can track changes in satisfaction over semesters and years
A dean...
-
Can access all the same types of analysis as a head of department, but at school/faculty level
-
Can compare the different departments within the school/faculty
-
Is able to view areas for improvement and a list of the 5 best/worst courses
A president...
-
Can access all the same types of analysis as a dean, but at university level
-
Can compare the different faculties/schools
-
Can filter all data by year, faculty, department, course, etc.


